Explore the unique health insights offered by Biobot’s wastewater data
Uncover hidden health patterns, predict outbreaks, and track the impact of interventions with wastewater intelligence.
Explore a snapshot of our data below.
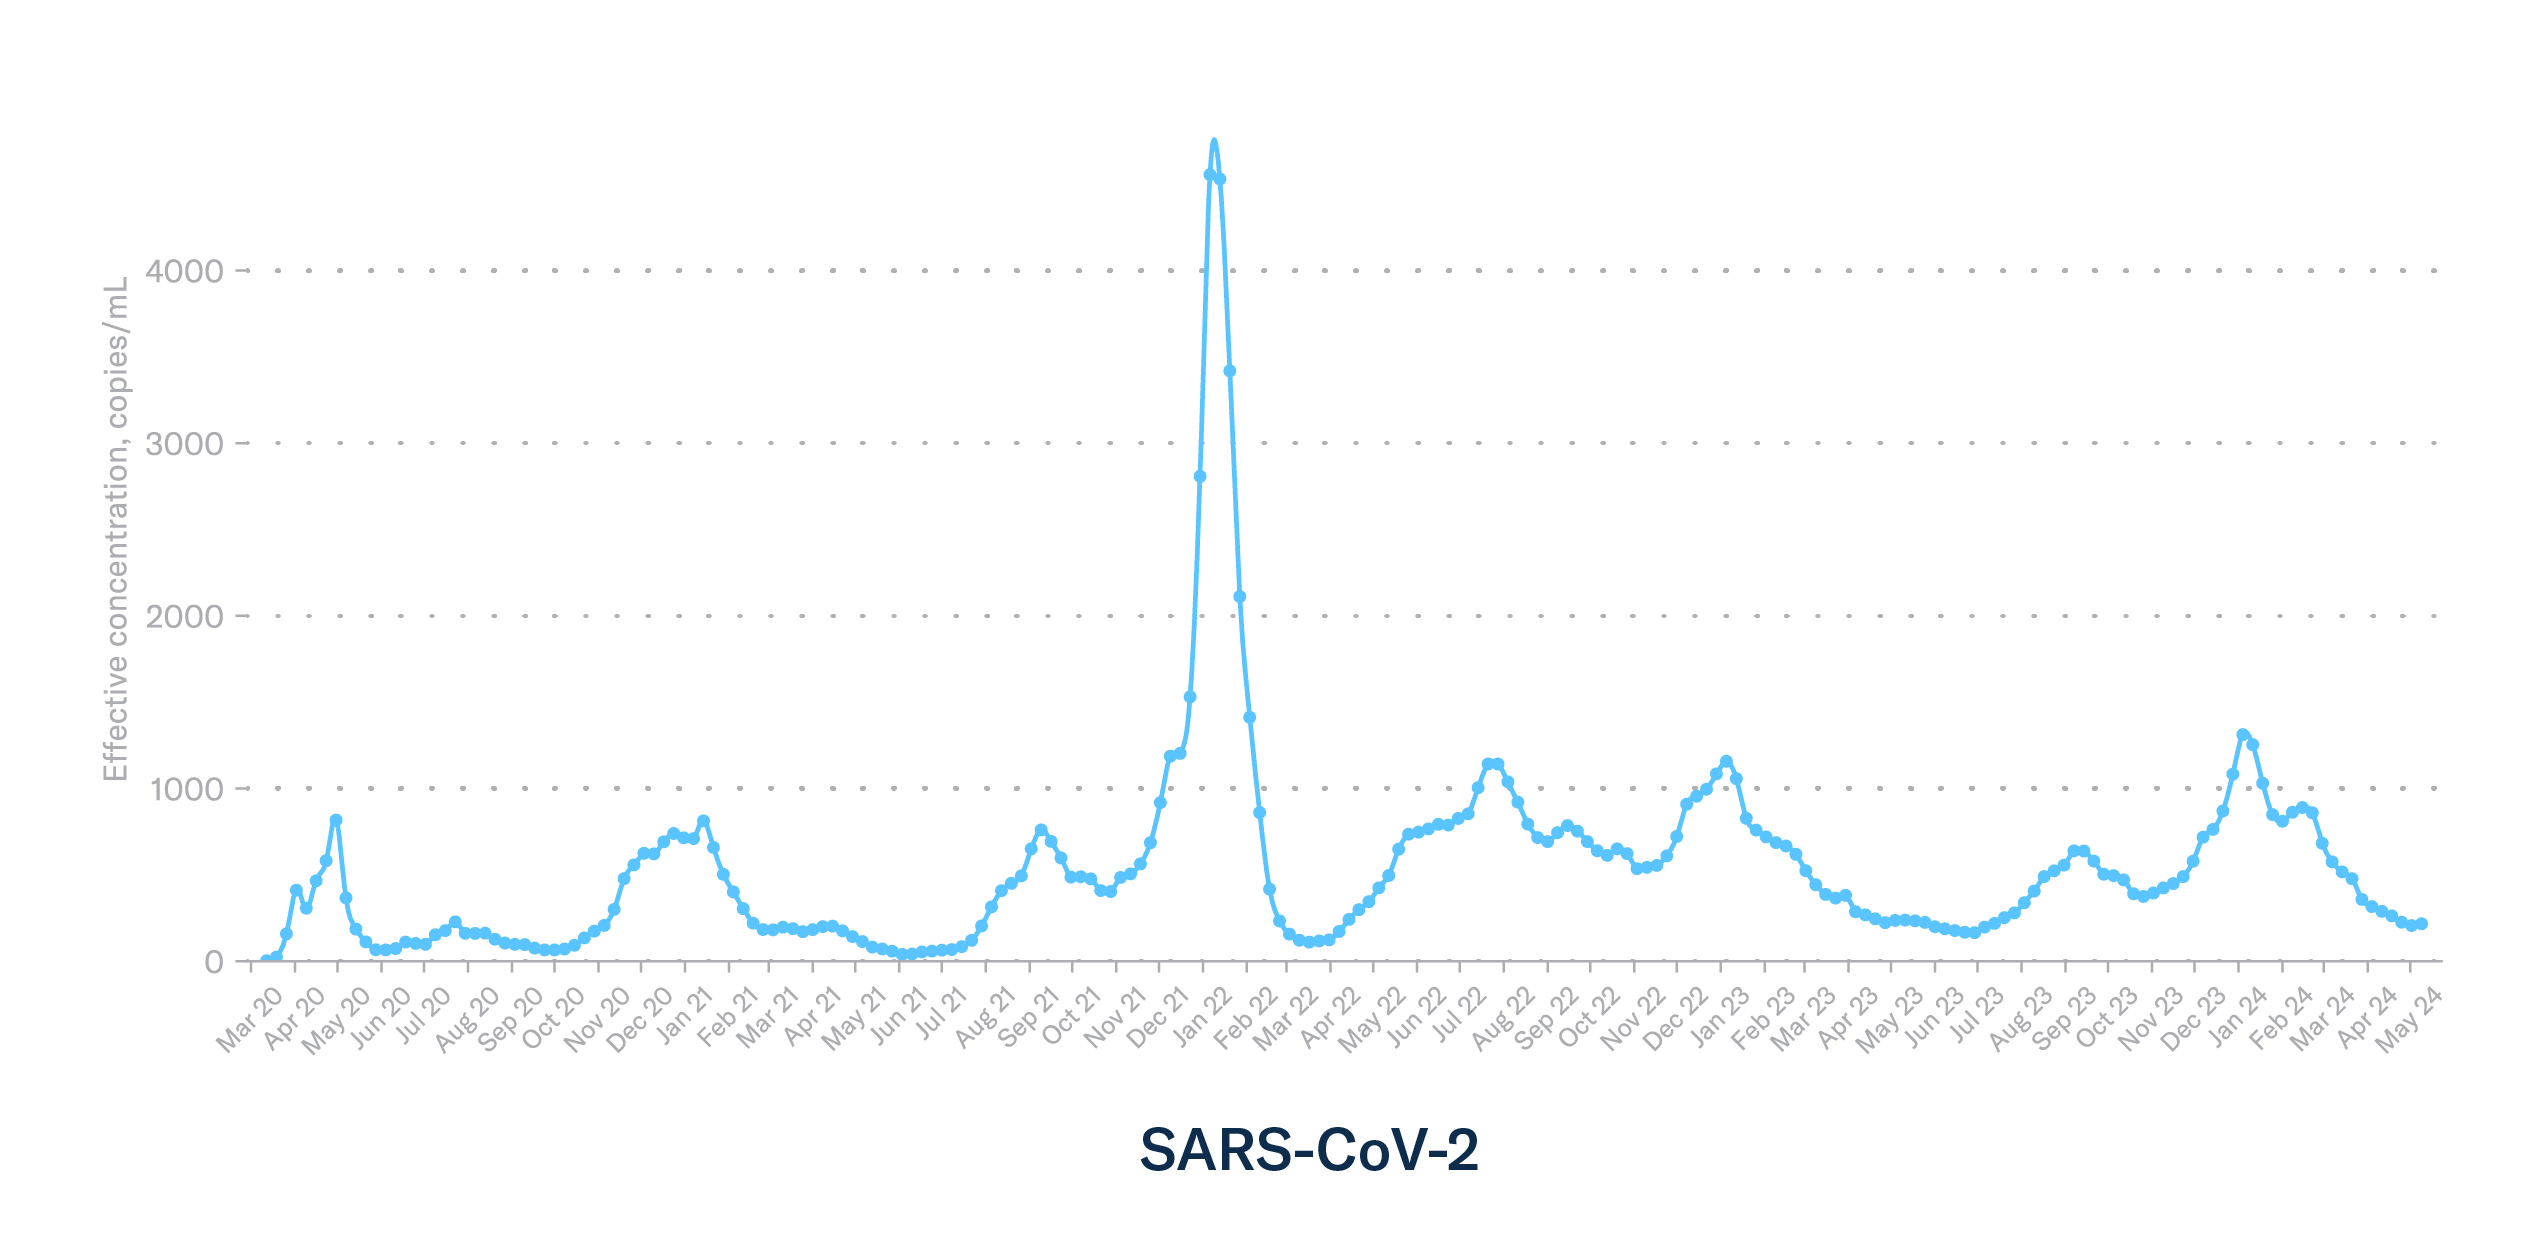
Understand the unique dynamics of a given disease
In today’s rapidly shifting population health and biosecurity landscapes, understanding the dynamics of any given disease through consistent monitoring is key to crafting interventions. Robust longitudinal datasets enable us to see patterns in viral evolution and disease dynamics, giving us the opportunity to forecast, predict, and plan for surges in viral activity.
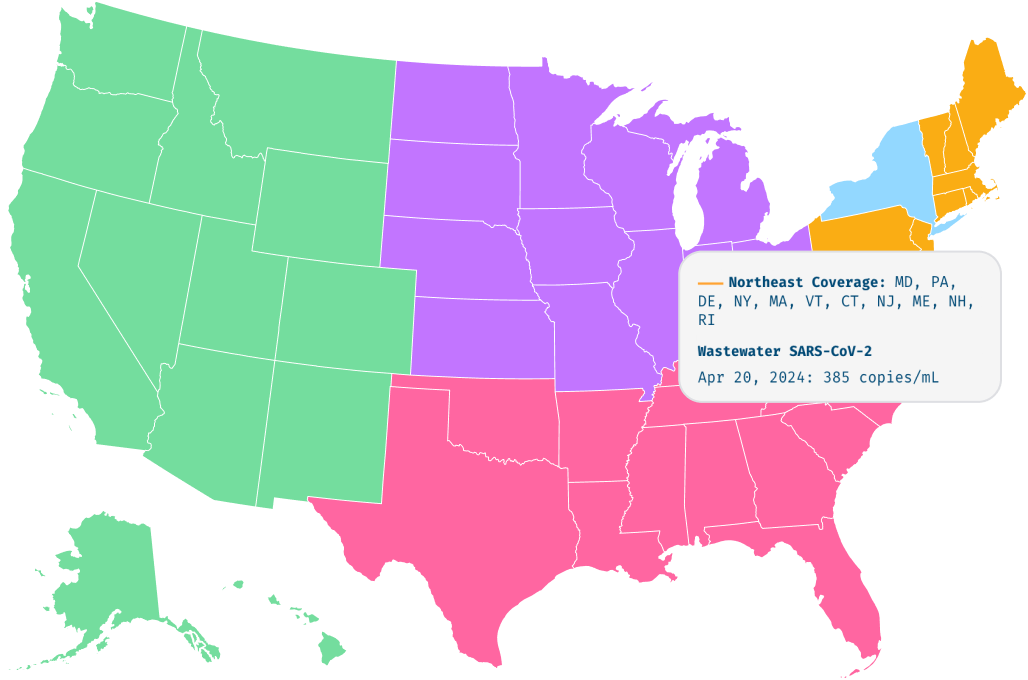
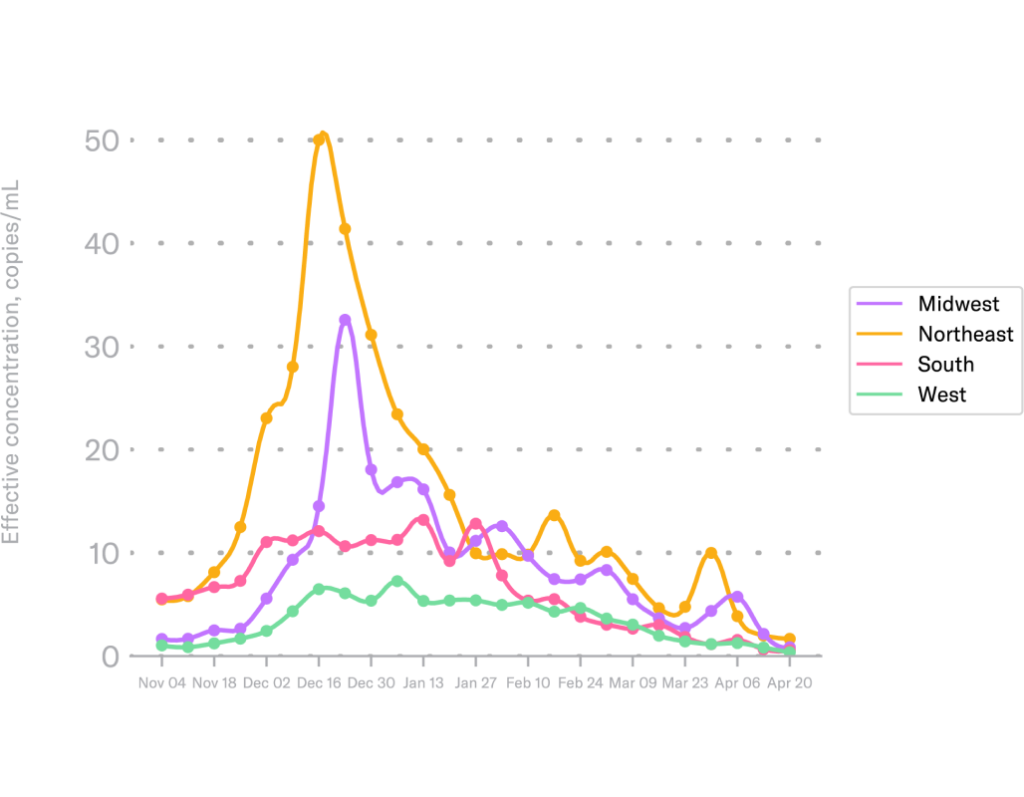
Our data offers a representative national picture with geographic granularity
Biobot’s wastewater data is generated by a single data collection & analysis method. This enables a comprehensive national picture and comparison across geographies.
Whether for biological or chemical targets, our wastewater data shows a national picture that can be drilled down to the regional, state, and local levels to gain better understanding of local and regional trends.

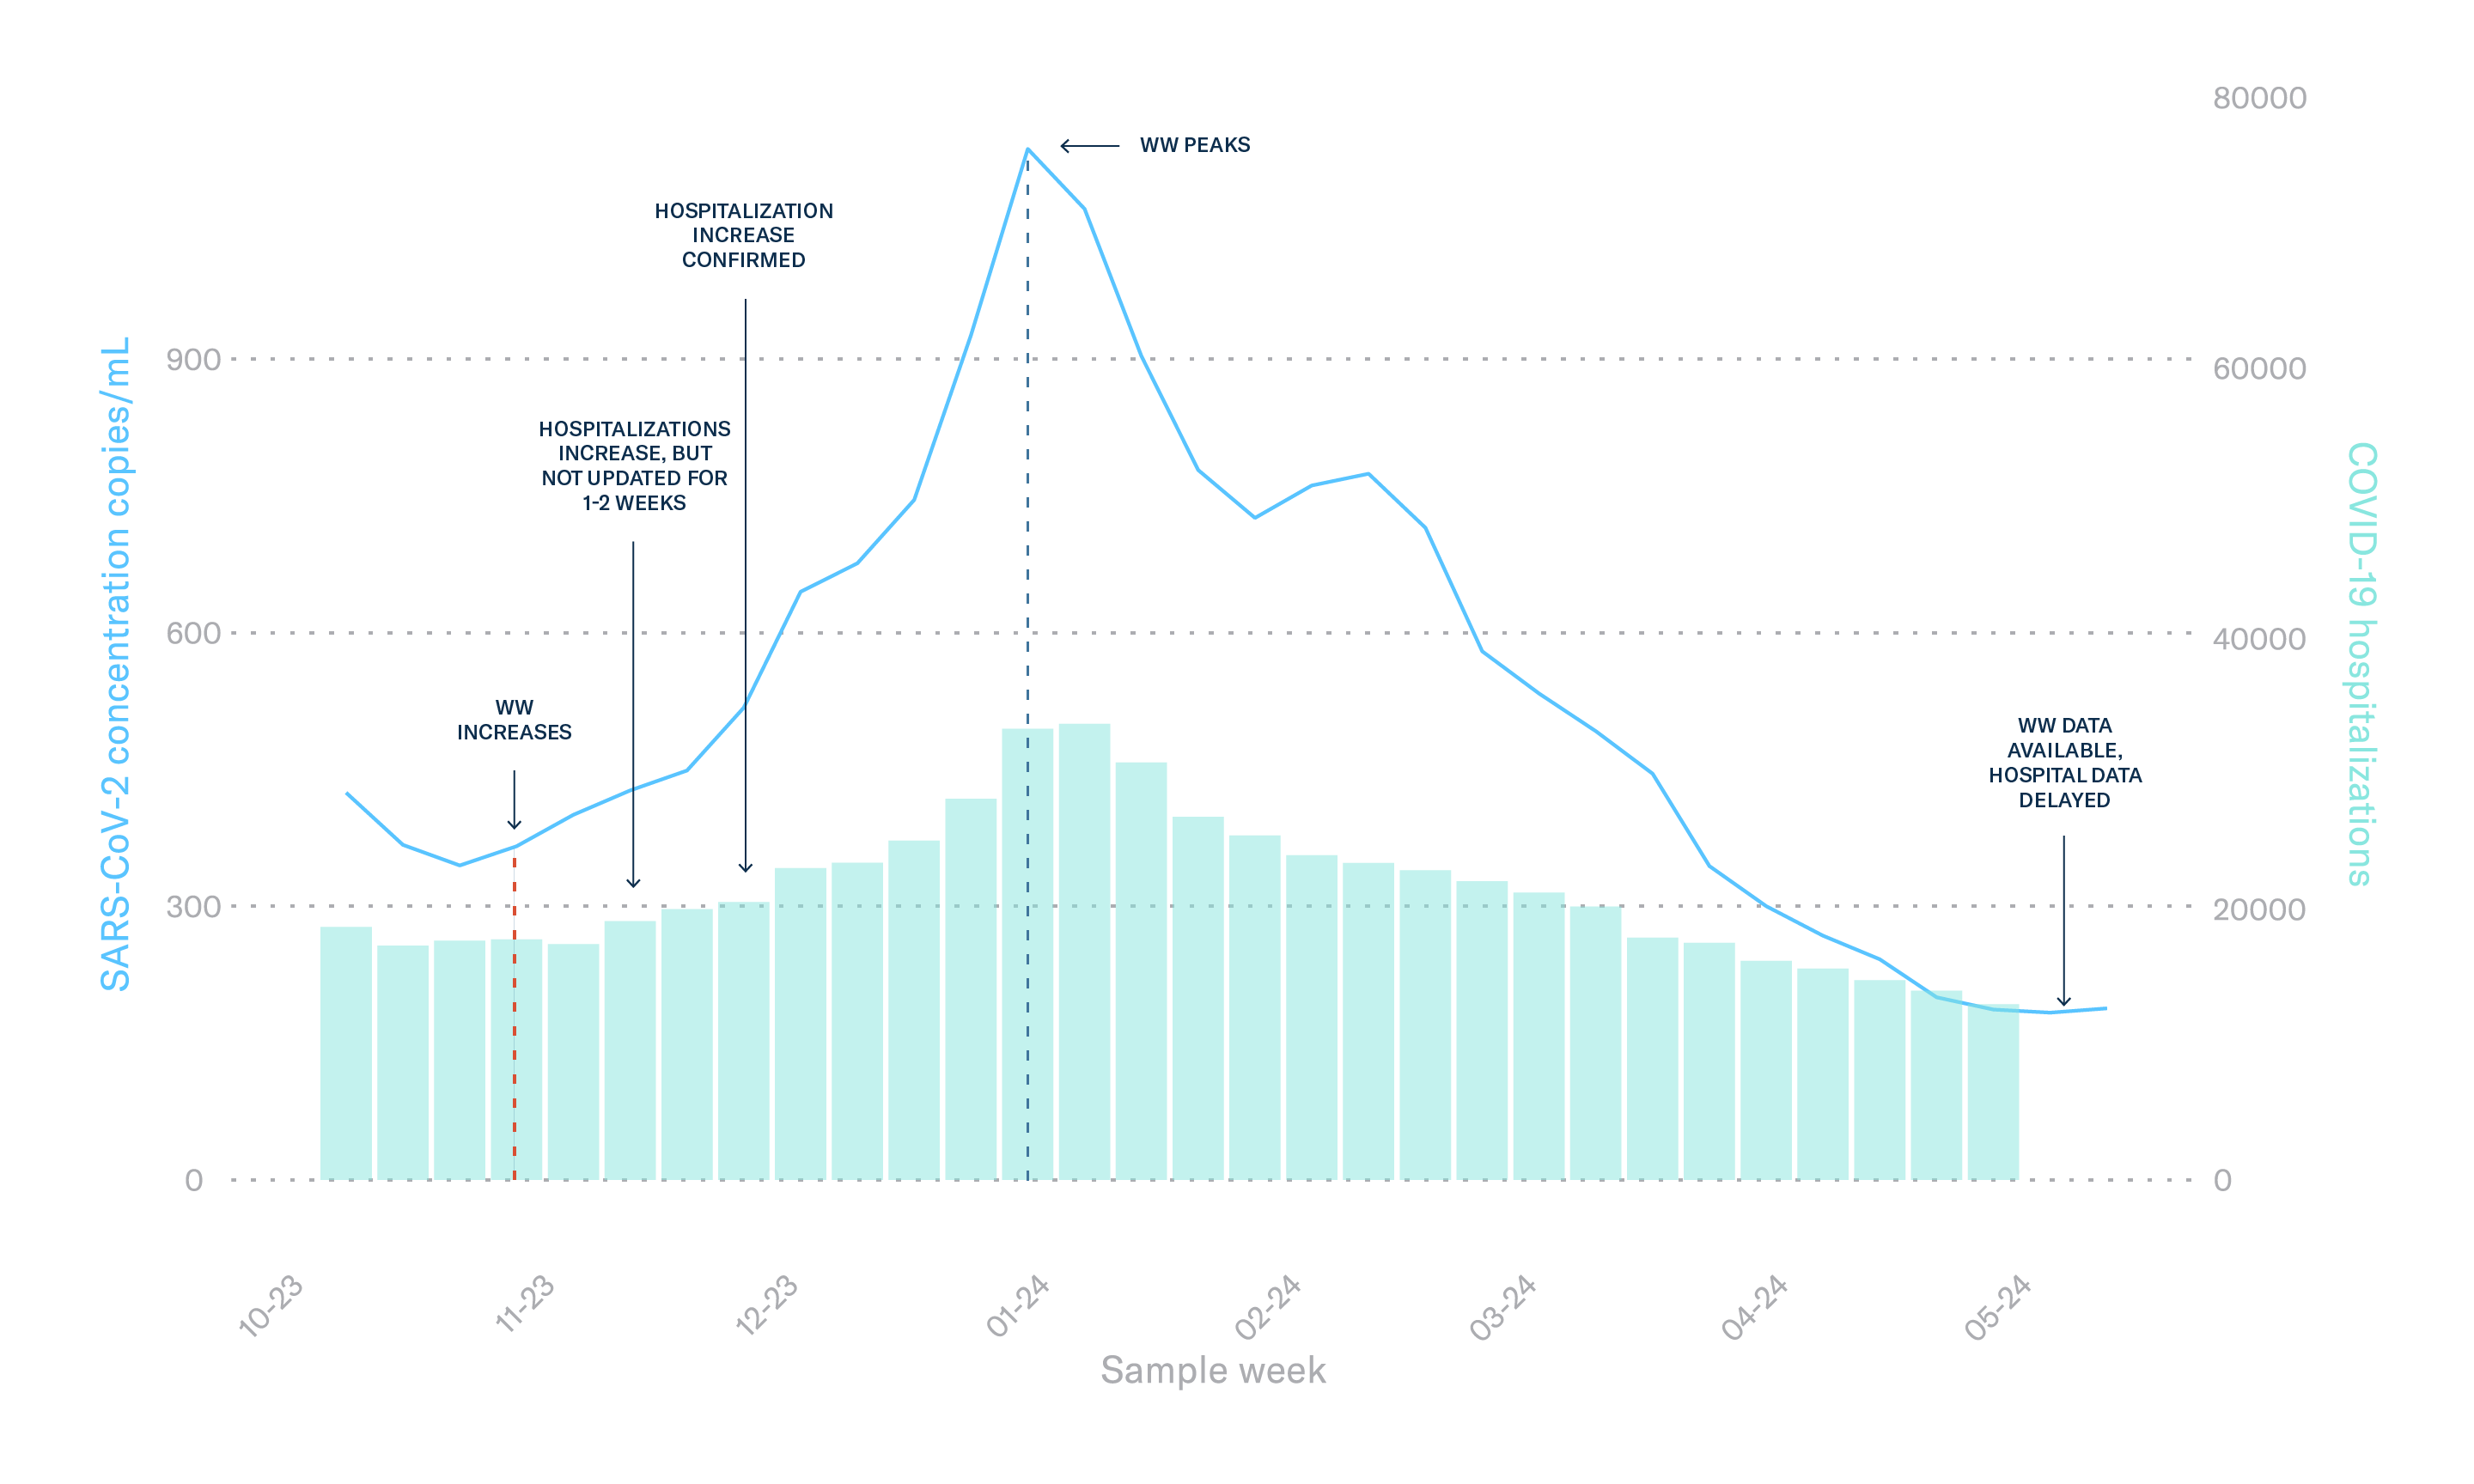
Our data offers real-time and predictive insights into disease burden
Omicron showed up in wastewater before symptoms led individuals to get clinically tested, if they chose to do so at all.
Wastewater data is an accurate representation of disease activity in our communities. In the early days of the COVID-19 pandemic when PCR testing was easily accessible and reported to population health, wastewater and clinical testing data tracked very well, and Biobot’s wastewater data offered an average of a three week lead time on spikes in hospitalizations.
An effective early warning system with strong correlation coefficients
Our wastewater data has proven to be a crucial tool in the fight against infectious diseases, showing high correlations with hospitalizations for COVID-19, influenza, and RSV. Not only is our wastewater data highly correlated with clinical data, but it is available 1-2 weeks ahead of publicly available clinical datasets. During the 2023-2024 respiratory season, the correlation between influenza A wastewater concentrations and flu hospitalizations was 0.96! This strong correlation underscores the reliability of wastewater monitoring as a near-real-time, predictive tool to help healthcare providers, public health, and vaccine and therapy developers anticipate surges in community viral activity, and allocate resources more effectively.
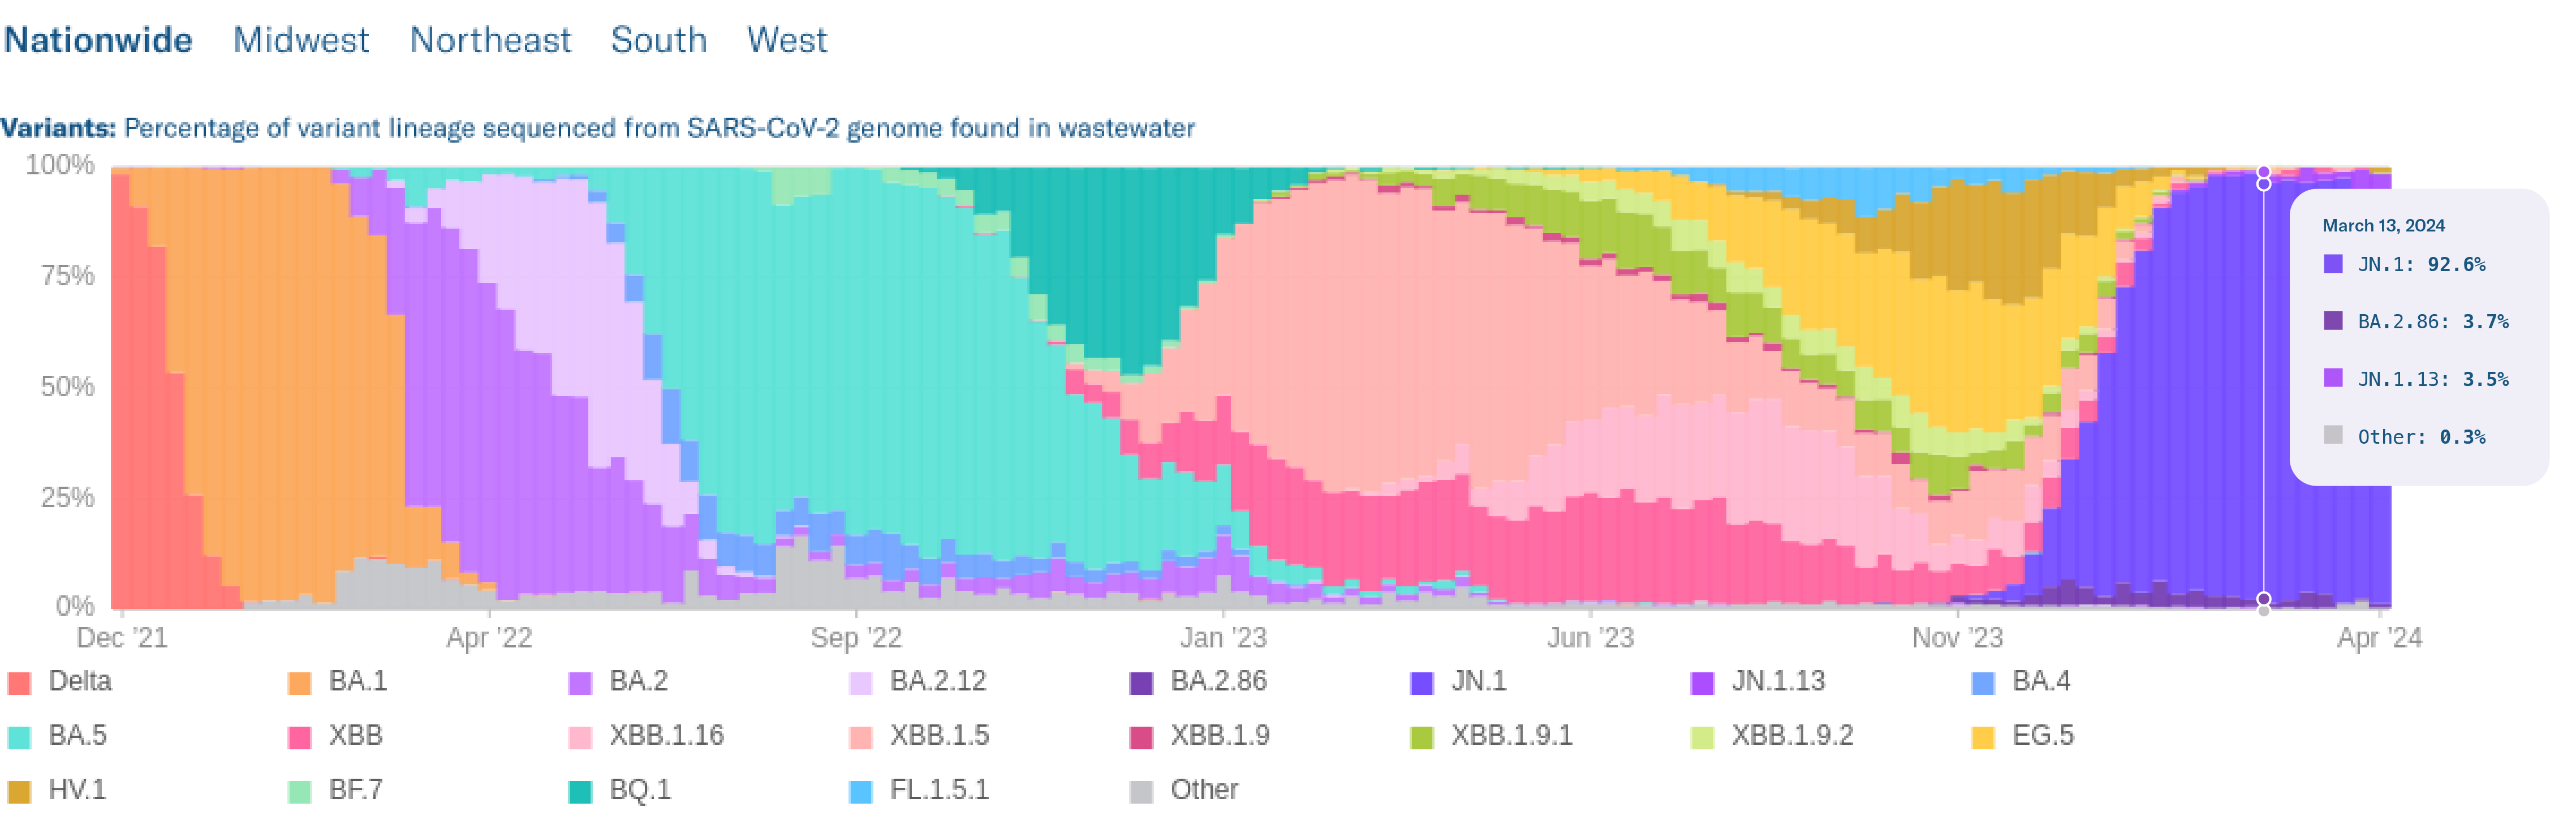
Understand and track virus mutations
Biobot delivers variant sequencing that captures and reports new variants as they emerge. This is a critical input for healthcare providers, vaccine and therapy developers, and others to keep communities safe and healthy.
Tracking variant prevalence in wastewater also provides insight into shifting viral dynamics. As mutations in SARS-CoV-2 arise and variants emerge, therapeutics and vaccines may become less effective. Understanding which variants are present regionally via wastewater allows clinicians to tailor therapeutic recommendations for patients, and helps clinics and hospitals plan for therapeutic demand and resource allocation. Tracking real-time spread of variants can also inform clinical trials and strategize therapy and vaccine improvements for future seasons.
Track low prevalence diseases
Even if a disease has a low prevalence (few active infections), the concentrated nature of wastewater can amplify the signal, making it easier to detect compared to relying solely on individual testing, which might miss isolated infections. An added benefit is the representation of asymptomatic cases. Wastewater doesn’t rely on individuals experiencing symptoms to get tested. It can pick up on those who might not realize they’re infected but are still shedding the virus, potentially contributing to its spread.
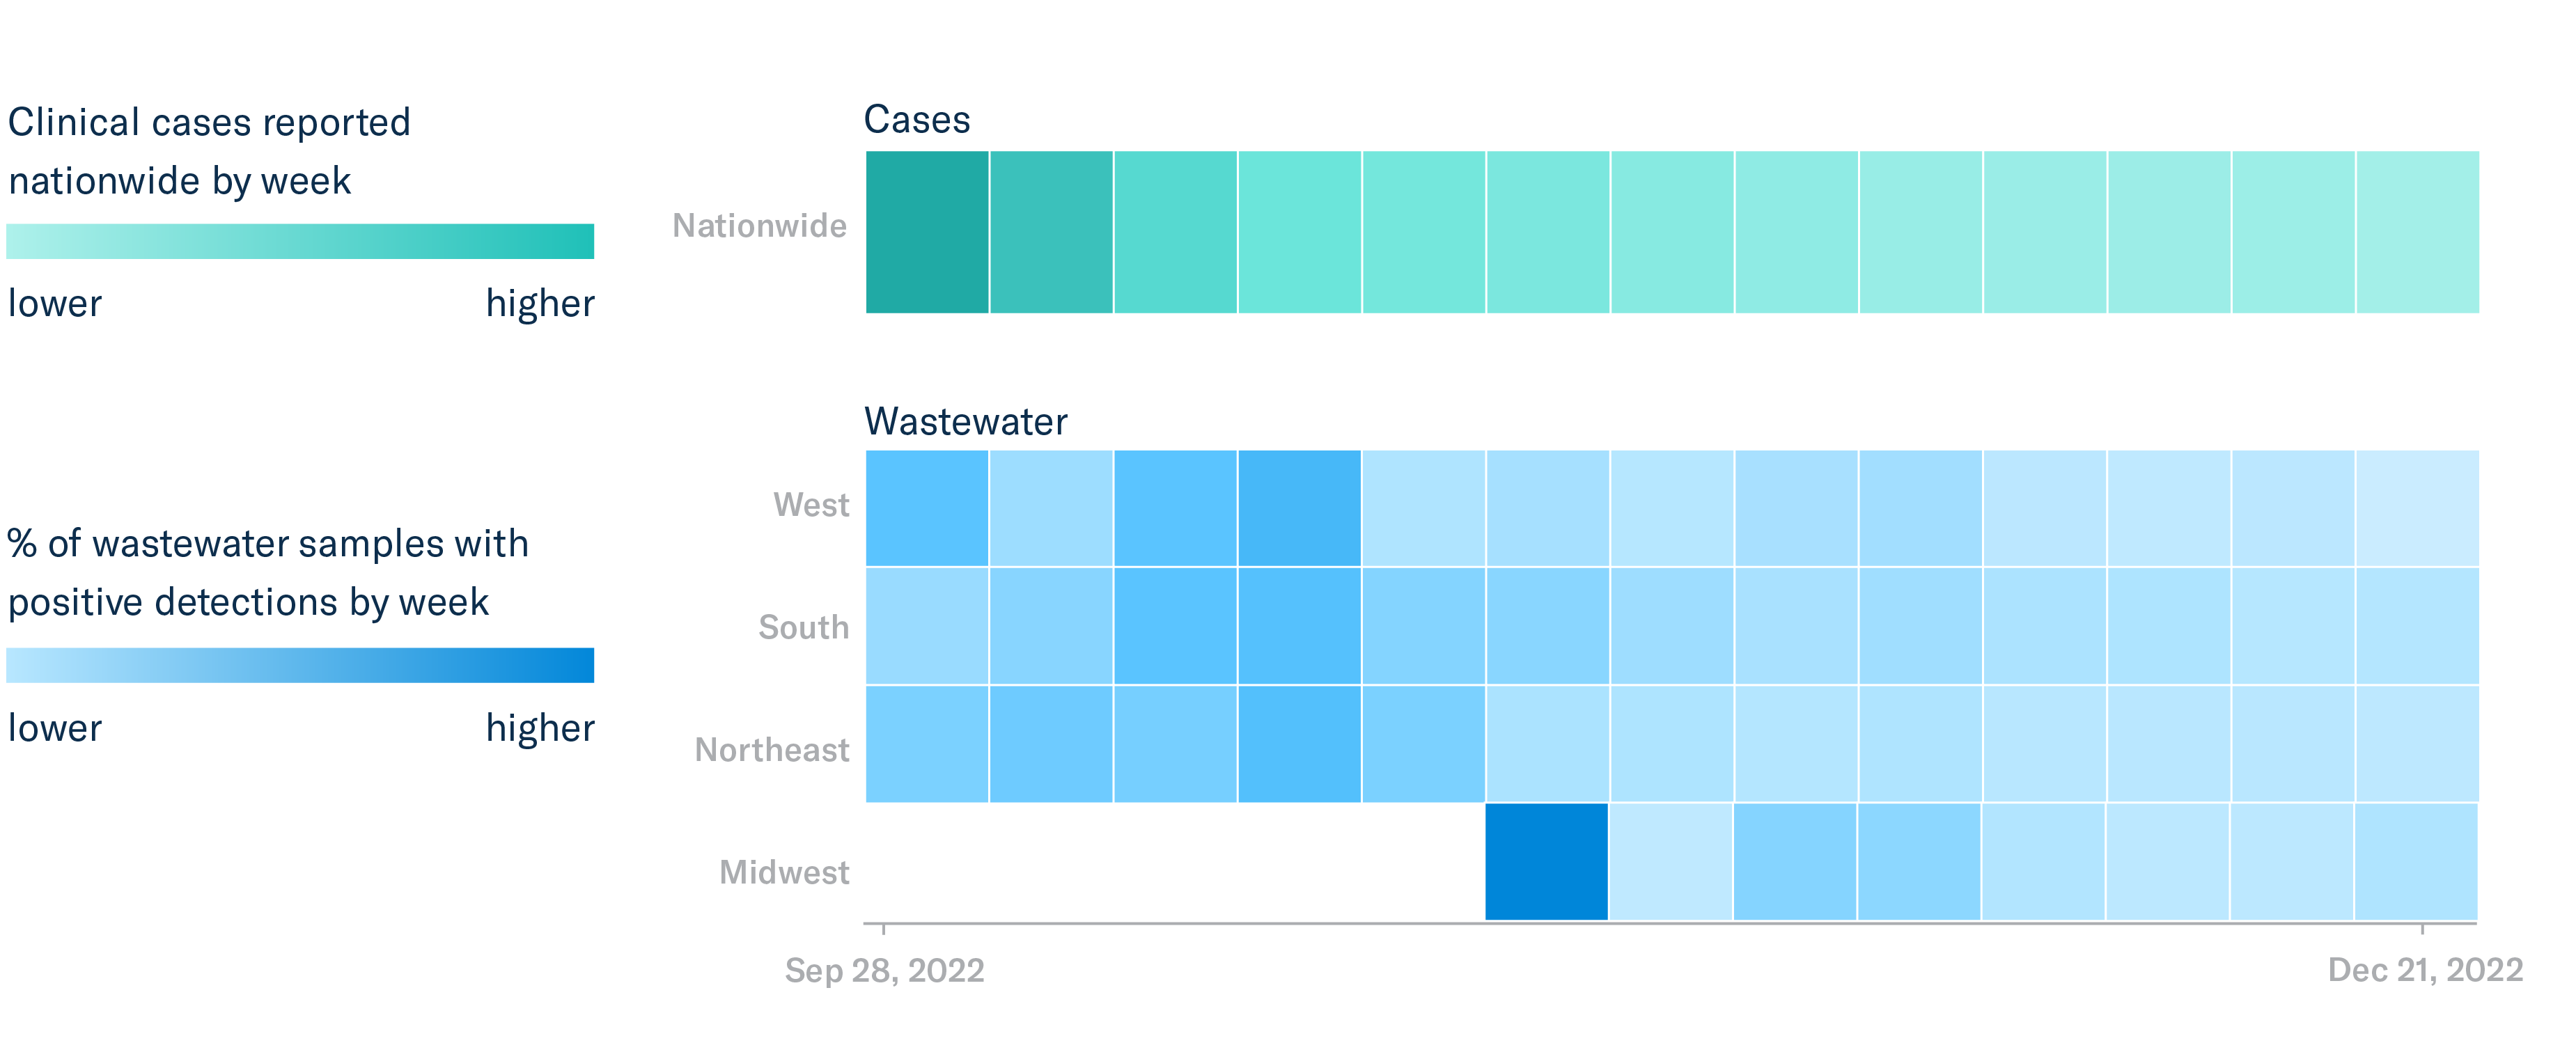
This chart shows the percentage of positive detections per week of the mpox virus (MPXV) present in samples of wastewater taken from across the United States, grouped by region, between October and December 2022 as well as the number of clinical cases reported nationally by week during the same time period.
Disentangle diseases and get a true picture of virus circulation
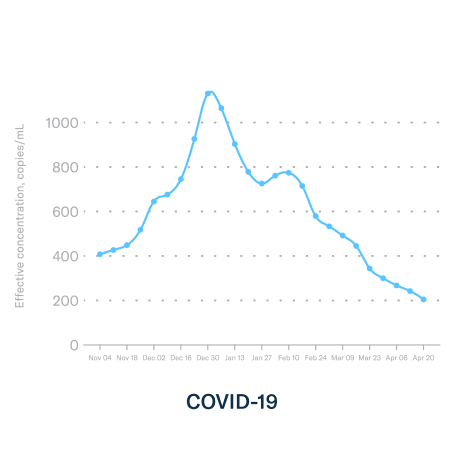
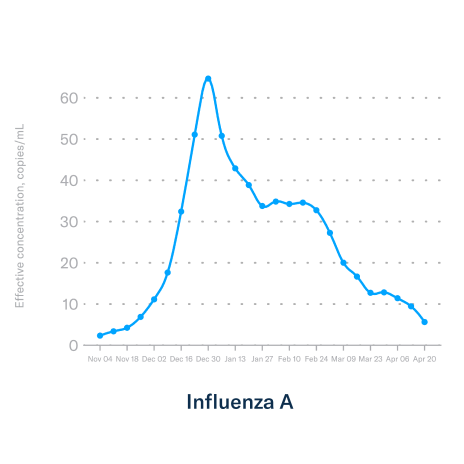
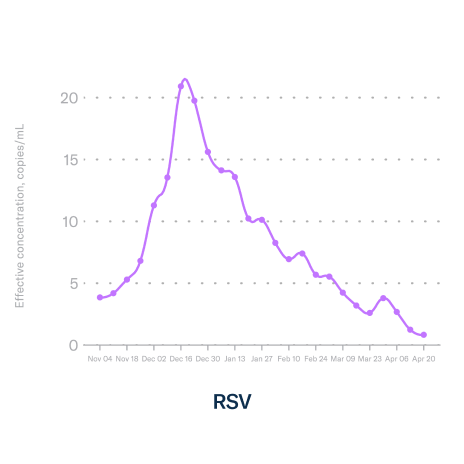
Wastewater data can separate out viruses with similar symptoms – like COVID-19, influenza, and RSV, to inform healthcare providers and government officials about true community viral activity. Why is this important? Treatments and community protection approaches vary by disease, even among diseases with similar symptoms. Data on case counts or hospitalizations are often only the tip of the iceberg of population health, and understanding the true extent of viral activity is crucial for decision making.

Get the latest analysis of COVID-19, flu, and RSV trends in your area:
Biobot’s Respiratory Risk Reports, published weekly throughout the respiratory virus season in the United States, offer a comprehensive national and regional view of circulating respiratory viruses. Our data science and epidemiology teams analyze data on COVID-19, influenza A & B, and RSV. The reports provide insights that can help you make informed decisions about your health by shedding light on emerging trends in respiratory virus activity and community viral load.
What you’ll find in the reports:
- National & regional trends: Understand trends in wastewater and clinical burden for respiratory viruses across the US.
- Expert analysis: Get insights from our data scientists and epidemiologists.
- Actionable information: Make informed decisions about your health, especially during peak transmission periods.
Interested in seeing the data in real time?
Get in touch with our team for a live demo.